

Ecosystem service analysis supporting design for public value at sea (D4PV@Sea)
The research project Development for Public Value at Sea (D4PV@Sea) evaluated, via a co-creation process, a number of possible scenarios for the realisation of a Marine Multifunctional Landscape Infrastructure (MMLI). IMDC prepared a technical note on the ecosystem services methodology and state-of-the-art data to quantify the effects of the MMLIs. This formed the basis for the development of an ecosystem services evaluation tool consisting of an spreadsheet calculation tool for scenario comparison.
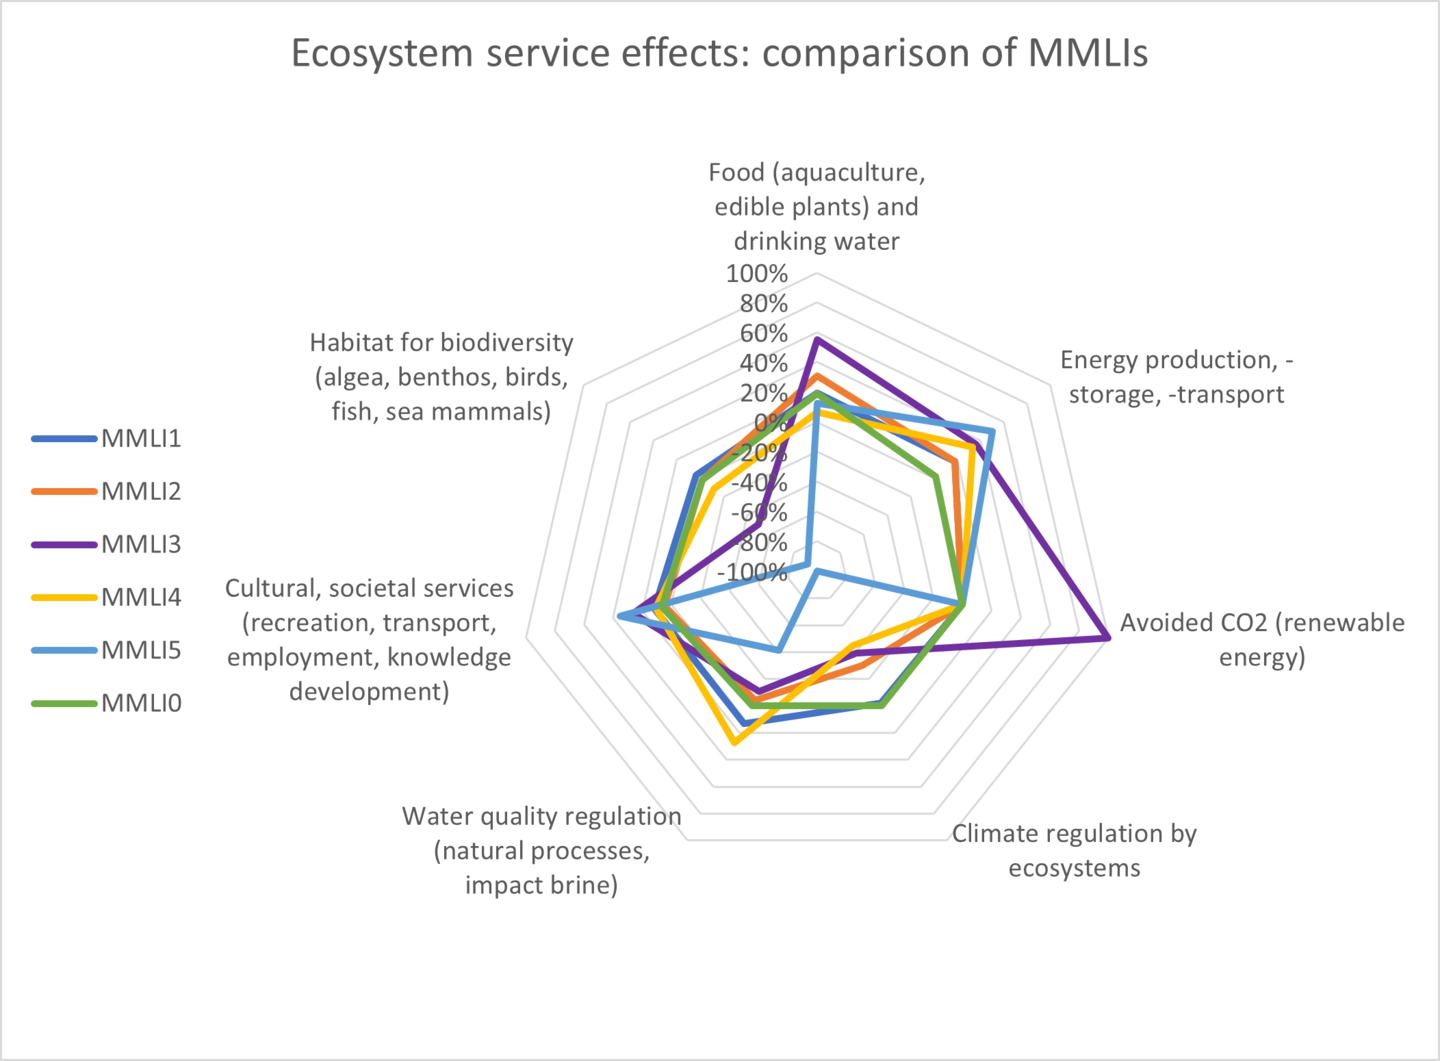
The research project Development for Public Value at Sea (D4PV@Sea) evaluated, via a co-creation process, a number of possible scenarios for the realisation of a Marine Multifunctional Landscape Infrastructure (MMLI). This project was led by ORG and DEME with partners Jan De Nul and Econopolis, and subsidising partners Vlaio and Innoviris. This included an analysis of ecosystem services, which allows for a scientific comparison of the different types of MMLIs based on their environmental, climate and human sustainability. IMDC prepared a technical note on the ecosystem services methodology and state-of-the-art data to quantify the effects of the MMLIs. Different habitat types and possible land uses are included in those scenario’s such as intertidal zone, dune area, and different mariculture options. For each of these land use/land cover types, the contribution on 42 ecosystem services (including socio-economic benefits) were assessed based on state of the art literature. This formed the basis for the development of an ecosystem services evaluation tool consisting of an spreadsheet calculation tool for scenario comparison. The outcomes are presented in diagrams with normalized values to compare different ES (values per ES are rescaled to 100%).
Data
- Client: Tractebel
- Start date: 2021
- Completion date: 2021


