
CFD modelling of wind loads and hydrodynamic resistance on ships
Wind load and hydrodynamic resistance are significant forces affecting ships, greatly influencing maritime operations and impacting vessel functionality and safety. In addition, estimating hull resistance is crucial for optimizing ship design and operational efficiency. An accurate resistance prediction enables designers and operators to optimize performance, minimize fuel consumption, ensure adequate power, enhance safety, and improve economic efficiency.
- The drag coefficient and distributions of the pressure coefficient along the centre of the deck were predicted for a simple geometry ship (Chalmers ship model).
- Wind forces acting on a 9000+ TEU container ship, scaled at 1:450, were simulated for wind angles of 0° and 90°.
- The resistance of two ships, the Duisburg Test Case and the KRISO container ship, was estimated under calm sea conditions.
The results demonstrate the capability of the setup models to accurately predict forces acting on the ships. Wind load simulation is valuable not only to optimize wind resistance during sailing, but also to assess wind loads for mooring design, especially in environments with nearby port structures causing complex wind fields. Regarding the ship resistance, accurate simulations can not only be used for hull resistance optimization but also to calculate bow wave conditions relevant for loads caused by passing vessels in ports.


Wind angle 0° on a 9000+ TEU container ship.
Top: The ship geometry with the corresponding velocity map at the vertical symmetry plane.
Bottom: Variation of the drag coefficient over time, with the blue line indicating the time-averaged value

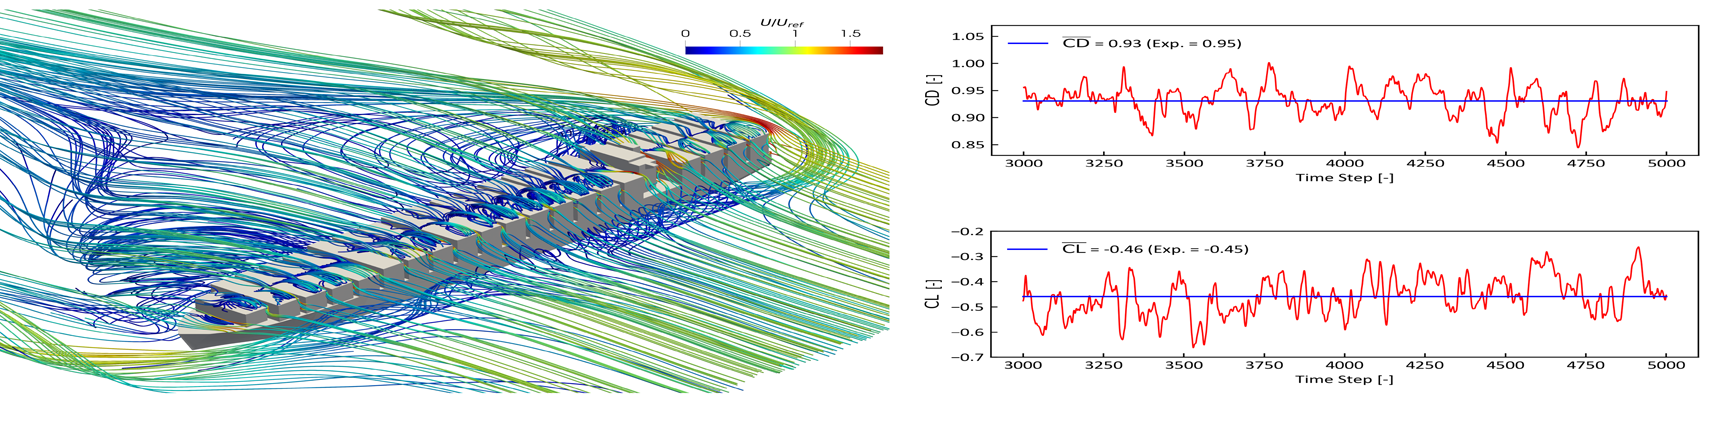
Wind angle 90° on a 9000+ TEU container ship.
Left: The ship geometry with the corresponding velocity maps at different vertical planes perpendicular to the ship.
Right: Variation of the drag (CD) and lift (CL) coefficients over time, with the blue line indicating the time-averaged value.

Top: Geometry of the Duisburg Test Case.
Bottom left: Time-averaged changes in the water surface around the ship for V = 1.335 m/s.
Bottom right: Variation of the forces acting on the hull ship over time

Top: Geometry of the KRISO container ship.
Bottom left: Time-averaged changes in the water surface around the ship for V = 1.648 m/s.
Bottom right: Variation of the forces acting on the hull ship over time