

Quantification and mapping of drought in Flanders with hydrological modelling tools
In this project IMDC developed a modelling toolbox for drought investigations in Flanders. The toolbox produces high resolution soil moisture and low flow drought maps for historical and future climate.
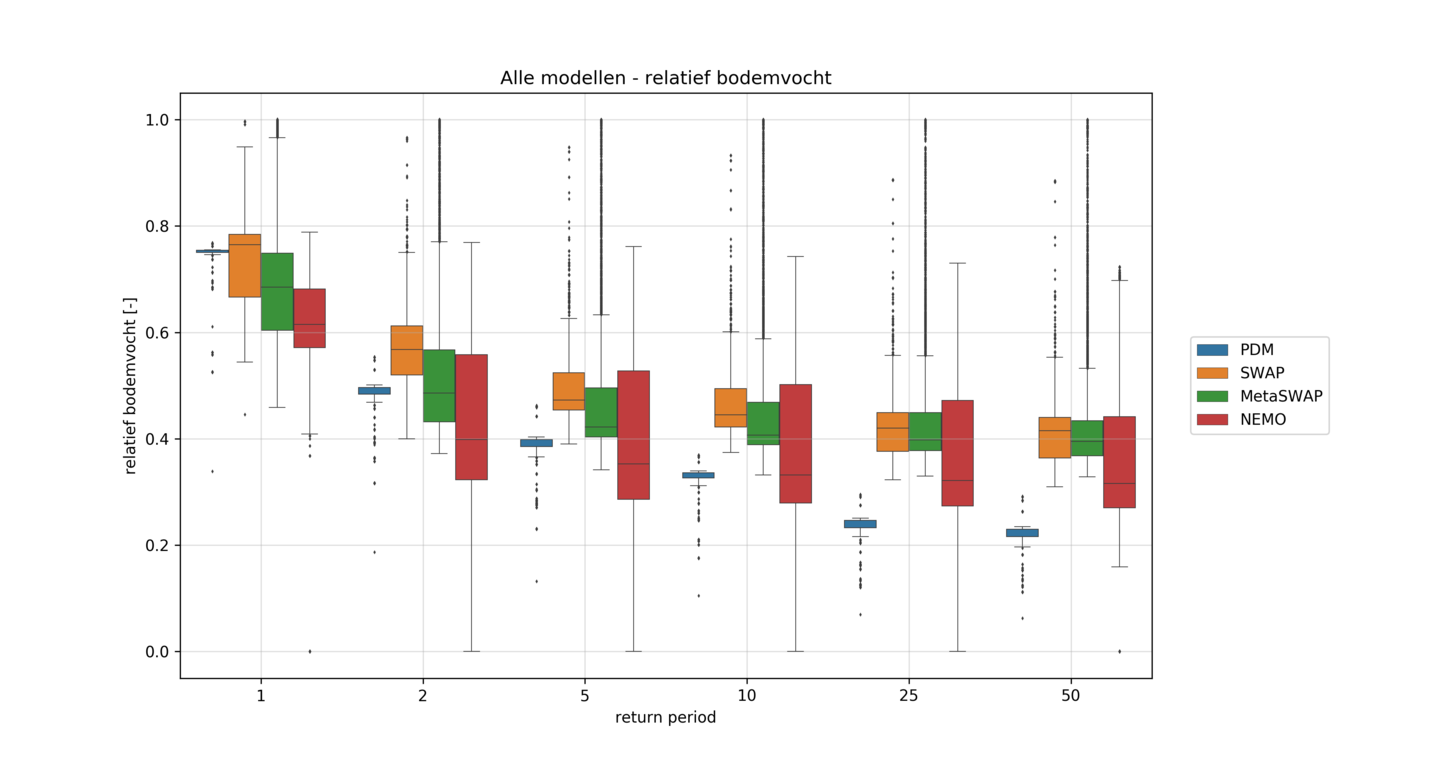
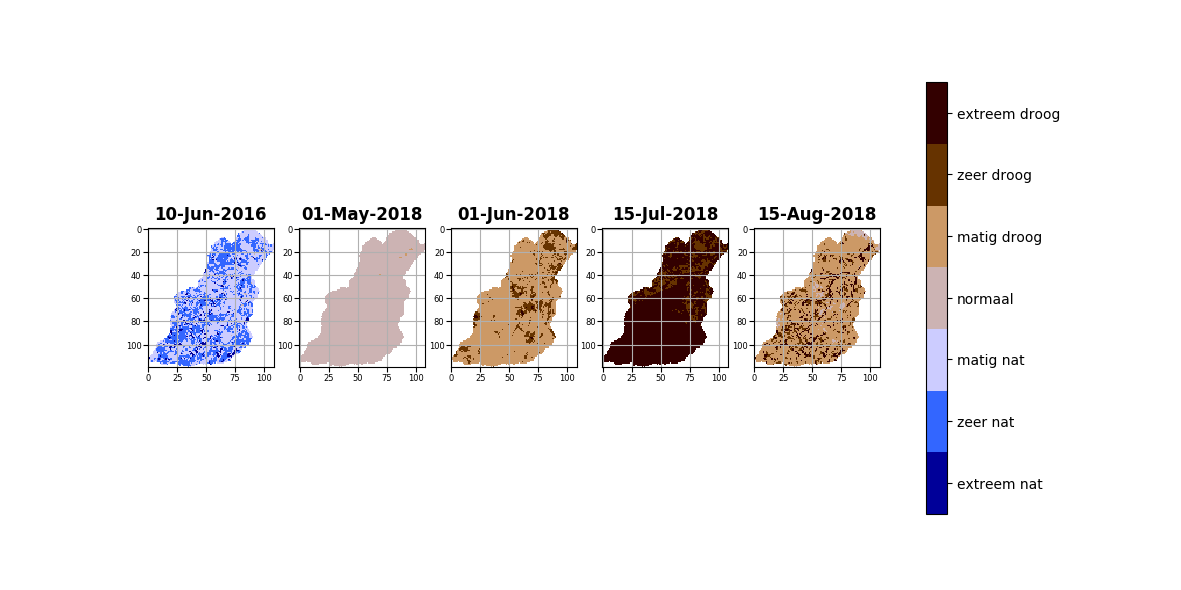
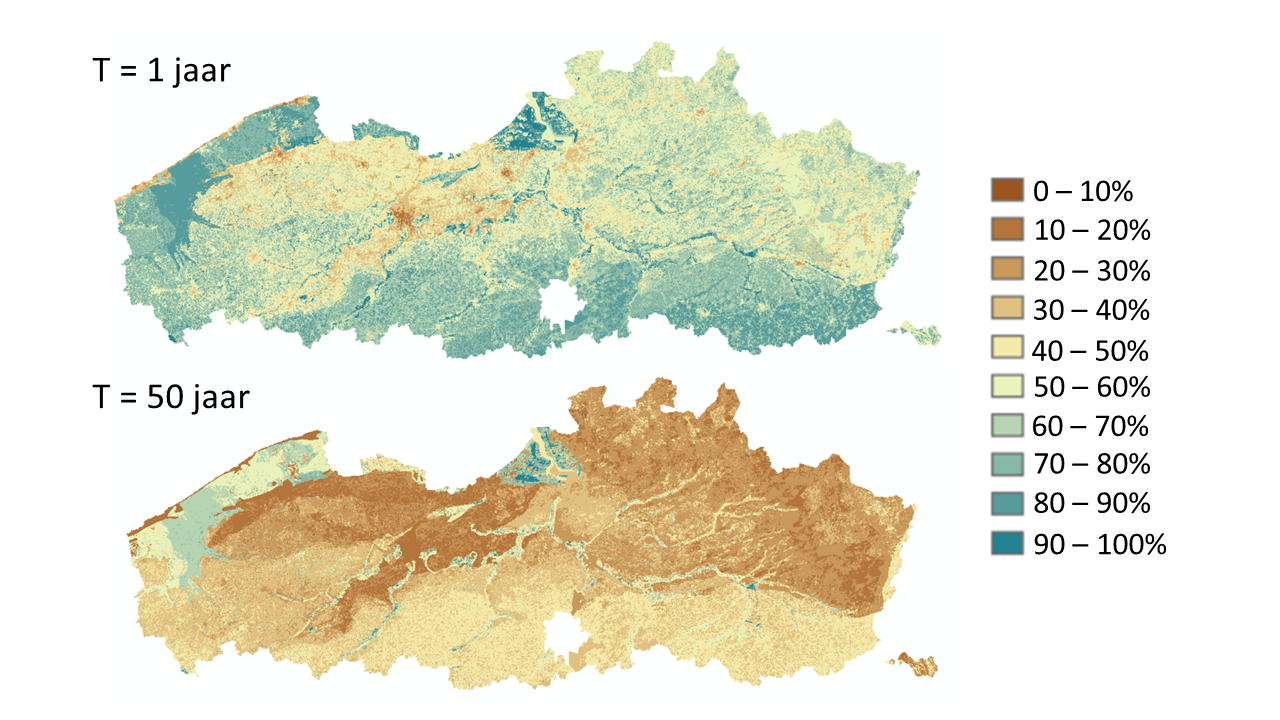
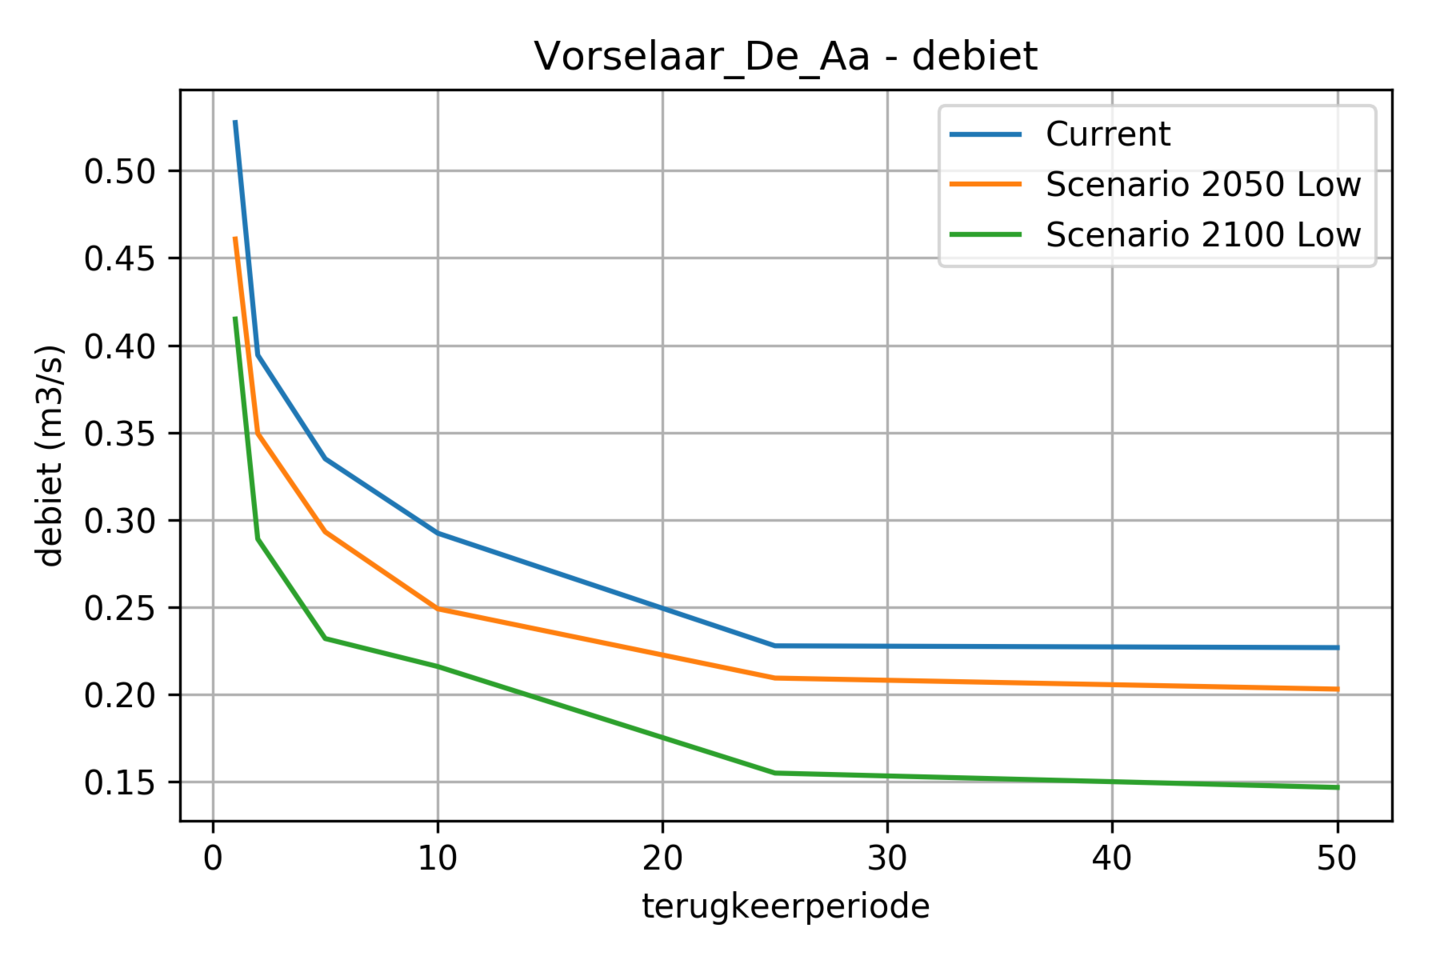
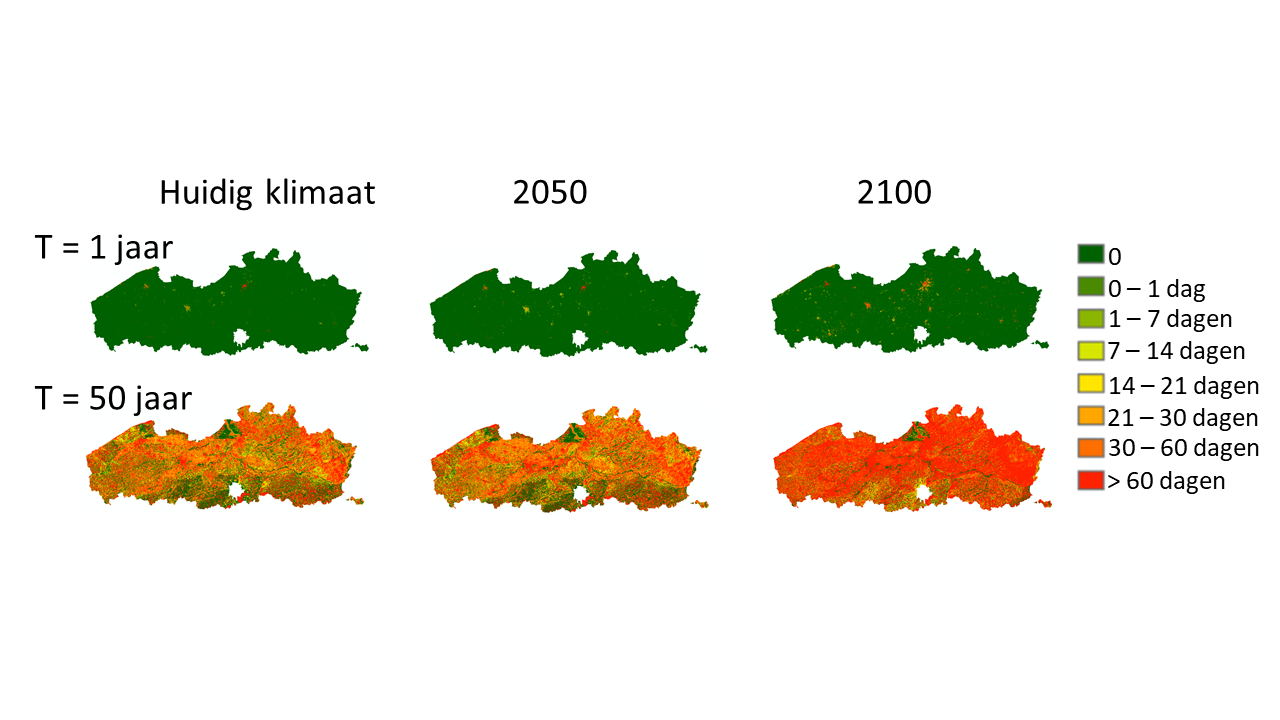
The project consisted of two parts. In the first part, the modelling toolbox was developed for single river catchments. For this purpose, existing model approaches were compared on the basis of reported results and implementation possibilities. Four model approaches, with model components for interception, runoff routing, infiltration and interaction with groundwater layers, were selected and tested on six Flemish catchments. The model approach with PDM for the simulation of rainfall runoff and SWAP for the simulation of relative soil moisture was selected for further implementation in the toolbox. In the second part, the toolbox was updated and extended to produce area-wide Flemish drought maps with a resolution of 50x50m. The toolbox produces soil moisture (agricultural) and low flow (hydrological) drought maps. These maps show absolute values of soil moisture and low flows, the number of drought days and the drought intensity for different return periods and this for the current and future climate.
By means of the developed toolbox, policy makers can quantify the severity of recent droughts, compare the recent droughts with historical observations and investigate the effect of climate change. Such information is of crucial importance for developing a tailored Flemish drought policy.
Data
- Client: Vlaamse Maatschappij
- Start date: 2018
- Completion date: 2021